2025-09-01
·JumpLens: Real-Time Dynamic Graphs, Video Overlays & Coach Data Analysis Toolset
·Computer Vision
·14 min read
Submission Details
Project: JumpLens
Description: Real-Time Dynamic Graphs, Video Overlays & Coach Data Analysis Toolset
Advisor: David Clement Johnson
Video Footage of: Jonathan Edwards, Jude Bright-Davies, Jazmin Sawyers, Leila Newth.
Submitted for: European Athletics TrHack Challenge
Designed & Developed by: SimEng
Affiliation at Submission: Belgrave Harriers, Achilles Club, ESM AC, University of Oxford (OUAC)
1. Abstract
JumpLens is a motion analysis system aiming to provide immediate feedback and analysis of horizontal jump performance via dynamic graphs, video overlays, and a coach data analysis toolset.
Elite competitions record a wealth of data, and often no further analysis is performed. JumpLens addresses this gap by utilising data visualisation and computer vision to provide metrics from athlete performance. This will facilitate commentators’ storytelling, improve spectators’ understanding of the event in real-time, and provide coaches with data-driven feedback to improve subsequent attempts.
Focus is given to triple jump due to its highly technical nature, and this approach can be expanded to other field events.
A software MVP was developed for this submission, with the system being in active development. The technology demonstrated here can be extended in different training contexts (e.g. hurdles, block starts, medicine ball, core exercises etc..)
Presentation Slides
View Presentation
2. Current State-of-Art Measurement Equipment
View Content
SEIKO and Ωmega Timing provide precise measurements in both track and field elite events. In this context we focus on SEIKO, which delivered timekeeping and precise measurements during the 2024 European Championships in Rome. Given the nature of the project, the focus is on their Measurement Systems, in particular their Jump Management System (JMS), Jump Video Distance Measurement system (JUMP VDM) and Triple Jump Phase Measurement (TJP).
Jump Management System: JMS employs a 300 FPS camera capturing long and triple jump takeoff, thus ensuring a clear view is provided to the judges to determine valid or foul jumps. Note the toe-board distance is also measured.
Jump Video Distance Measurement System: JUMP VDM is a two camera system installed in the spectator area. The measurement is achieved via software by positioning the cursor onto the landing mark on the frame visible on the operator’s screen.
Triple Jump Phase Measurement: TJP employs 60 FPS high-resolution cameras capturing the full attempt from run-up to landing, thus measuring important metrics such as speed, flight time and phase distribution.
3. Gaps & Opportunities
View Content
The following key constraints have been identified, requiring innovation at both elite and grassroots level.
- Gap in data access.
- Limited spectators engagement.
- Talent development barrier.
3.1 Elite Level Data Access Constraints
During the Triple Jump finals at 2024 European Athletics Championships, performance metrics were captured by the SEIKO measurement equipment. However only the official distance and wind were displayed on the event board once the athlete’s attempt was completed.
While SEIKO’s technology is extremely sophisticated and able to measure distance, height, and speed of each phase, as well as phase distribution, this data is inaccessible to coaches and athletes in real time or post competition.
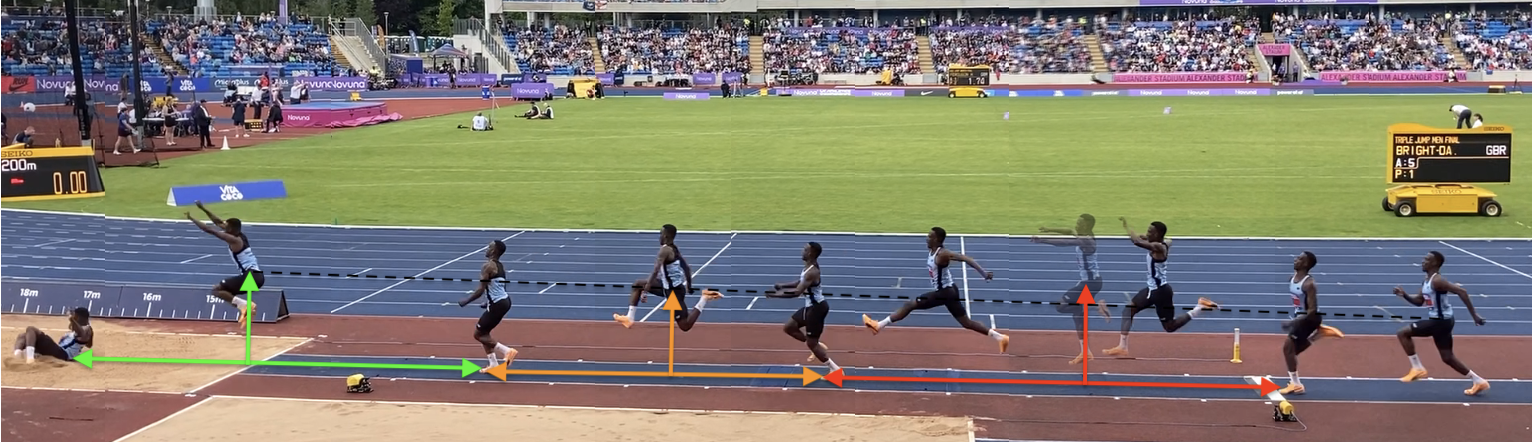 Fig. 1: Jude Bright-Davies’ 5th Attempt Triple Jump Finals, Novuna UK Athletics Championships - 2025 Alexander Stadium, Birmingham, England, UK.
Post-attempt, there is no formal platform or formal feedback mechanism for coaches and their team to review details about the athlete’s attempt aside from relying on recorded video footage.
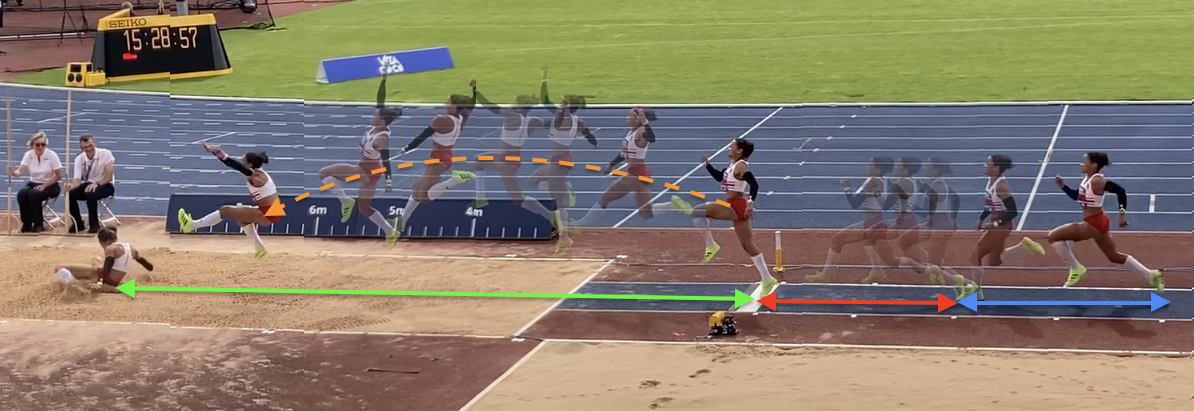 Fig. 2: Jazmin Sawyers’ Long Jump Finals, Novuna UK Athletics Championships - 2025 Alexander Stadium, Birmingham, England, UK.
Therefore, there exists a gap between data collection, data visualisation and accessibility.
3.2 Grassroots Level Data Access Constraints
Similarly to section 3.1, grassroots competitions also experience a lack of data accessibility as well as data collection.
While elite events have sophisticated hardware systems, grassroots level competitions often lack these kinds of resources.
There is no affordable system that can be installed during club-level competitions (e.g., National Athletics League - NAL or Southern Athletics League - SAL) to analyse athletes’ attempts and provide feedback post-competition, or to be integrated with online live boards such as OpenTrack. Having such a system would make a significant difference in performance improvement and understanding of highly technical events. Such a system would positively impact athletes’ progression and improve coaching quality, which in turn affects talent development.
3.3 Talent Development Barrier
The constraints identified in sections 3.1 and 3.2 contribute to talent development barriers. Technical improvements can be achieved by identifying what went wrong in competition settings that often cannot be replicated during training sessions. Moreover, in circumstances where the coach is not present at the athlete’s competition, they may want to review the performance at a later stage and provide effective guidance accordingly.
3.4 Limited Spectators Engagement
Finally, something that is sometimes overlooked is the broadcasting of field events. In particular, triple jump is often poorly understood or not at all by viewers who may not be familiar with the event. Providing access to dynamic graphs for spectators, and providing more in-depth data to commentators (such as phase distribution, flight times, and angle of takeoff) can improve technical analysis of the event as well as a more concrete comparison between athletes other than official distance comparison.
4. Solution & Approach
View Content
The proposal is twofold,
-
A comprehensive platform with tailored spectators’ and coaches’ access.
-
Affordable equipment for grassroots competitions to collect data and support coaching
Following is the proposed deisgn for both components.
4.1 Software
The software component relies on standardized athletes’ data collection to ensure consistent analysis and comparison across different competitions and equipment used.
4.1.1 Software Architecture
Once the data is collected from the hardware, it must be processed and upserted into the athlete record or corresponding entry in the table via athlete and meeting identification numbers. These structured data are collected and managed using a PostgreSQL database (i.e., Supabase).
 Fig. 3: Proposed software architecture diagram.
The data is retrieved via API calls to read-only endpoints and displayed on the page. When a video file is uploaded for analysis, it is validated (i.e., size, type, and format are checked). During this asynchronous process, the source is sent to a GCP Cloud Run service that was deployed using Docker. analyse_video.py analyses video frames using the MediaPipe library, biomechanical data is extracted, and a new video is generated and displayed with the frontend together with CSV data.
The result is stored in an S3 bucket whose URL is located in the database
The database schema found here was identified as being necessary for this purpose.
4.1.2 User Interface (UI) Design
Upon log in, users are identified through their authentication credentials and roles (i.e. standard user or coach). Role-base access control (RBAC) guarantees that coaches retain all privileges of standard users whilst gaining additional privileges.
COACH PROFILE
The coach profile represents an important feature that we aim to further develop to become an integral component of athlete development.
 Fig. 4: Example of coach profile page.
Coach profiles should be provided to authorised and qualified coaches only. Each athlete record Athletes under the same coaches are grouped together via SQL query and the list is displayed on the My Athletes page.
For example for David C Johnson it would be,
const { data, error } = await supabase
.from('JUMPLENS_ATHLETES')
.select('athlete_id, name, surname, club, event, country, image')
.eq('lead_coach', 'David C Johnson')
.order('name', { ascending: true });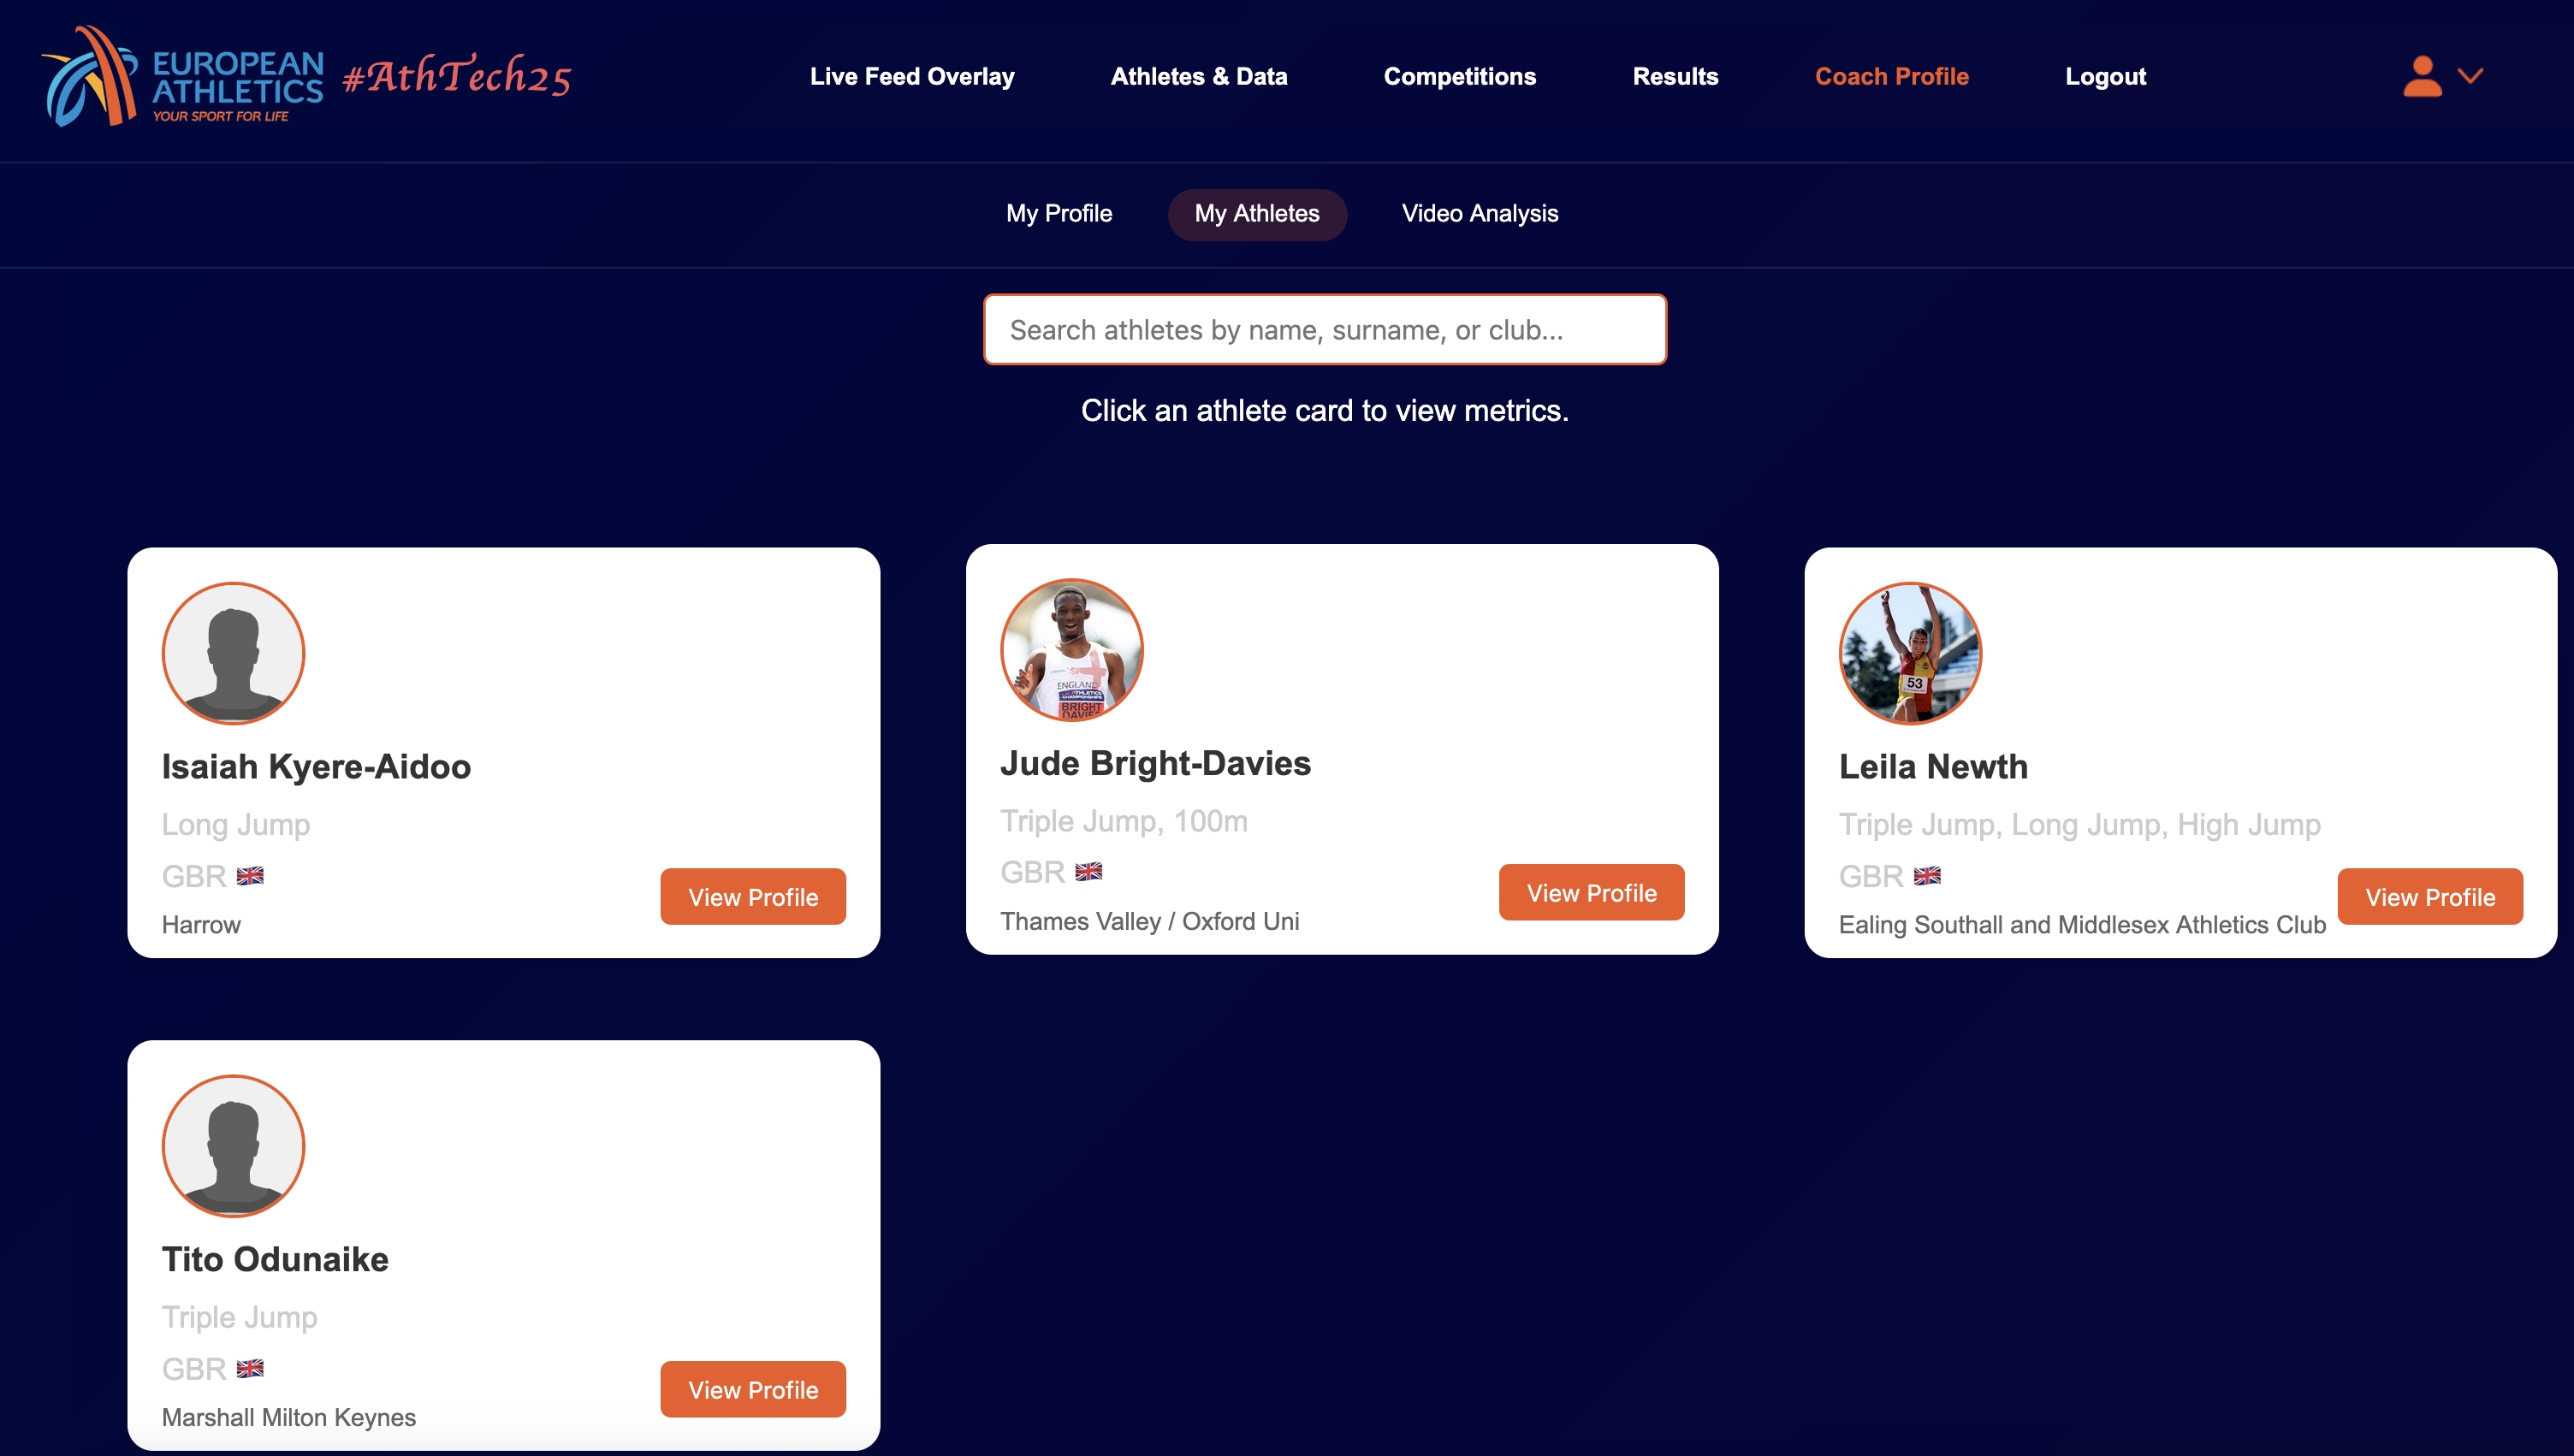 Fig. 5: Example of
 My Athletes page.
The coach can view more information about their athletes by clicking View Profile.
A filter is provided within the athlete profile to view competitions. Upon selection, a page is loaded with a summary of the performance for the selected event.
The C.O.M. trajectory and speed curve of the best attempt during the competition should be provided as a means to identify areas for improvement.
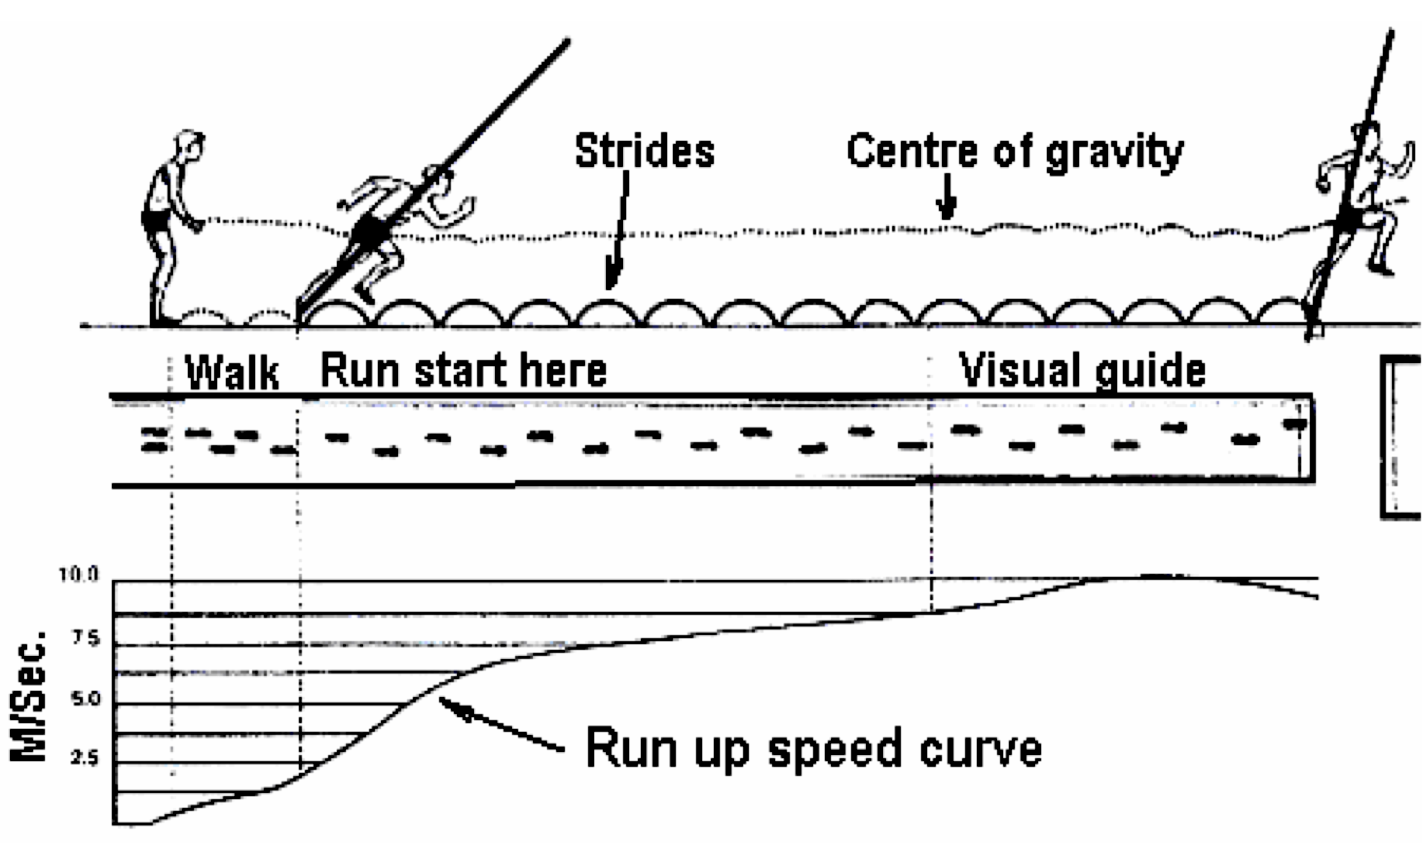 Fig. 6: Speed profile expected for a good run-up.
A long or triple jump run-up should have a specific speed profile resembling Figure 6.
The Video Analysis section in the coach profile, is a developmental feature that provides the option to upload a video up to a certain size for analysis. The coach can drag and drop or “browse” for a video to upload.
The file is validated to ensure it satisfies requirements (e.g. the format must be mp4, mov, avi, webm, etc.). An API call is sent to https://jump-lens-video-analysis-####### via the POST method, with the uploaded video as the request body.
The process occurs asynchronously, where a task_id is returned to track the progress of the analysis, providing information on screen. The data is also returned in JSON format.
Please note that the video playback speed has been increased to 1.2x to reduce file size.
The feature is still in the experimental phase, and the efficiency and speed of analysis is very dependent on the internet connection. Poor connection can cause upload failures or timeouts.
It is dependent on the GCP Run resources CPU/Memory, which is important for processing. To mitigate this, a limit was set for the file size and format. More investigation is needed to make the feature more robust.
OVERLAY
The live feed overlay is currently subdivided into Long Jump, Triple Jump, and Live Results sections.
Both Long Jump and Triple Jump sections provide a filter to select the overlay type:
- Single Athlete Metrics
- Athlete Comparison
- Phase Analysis
- Biomechanical Analysis
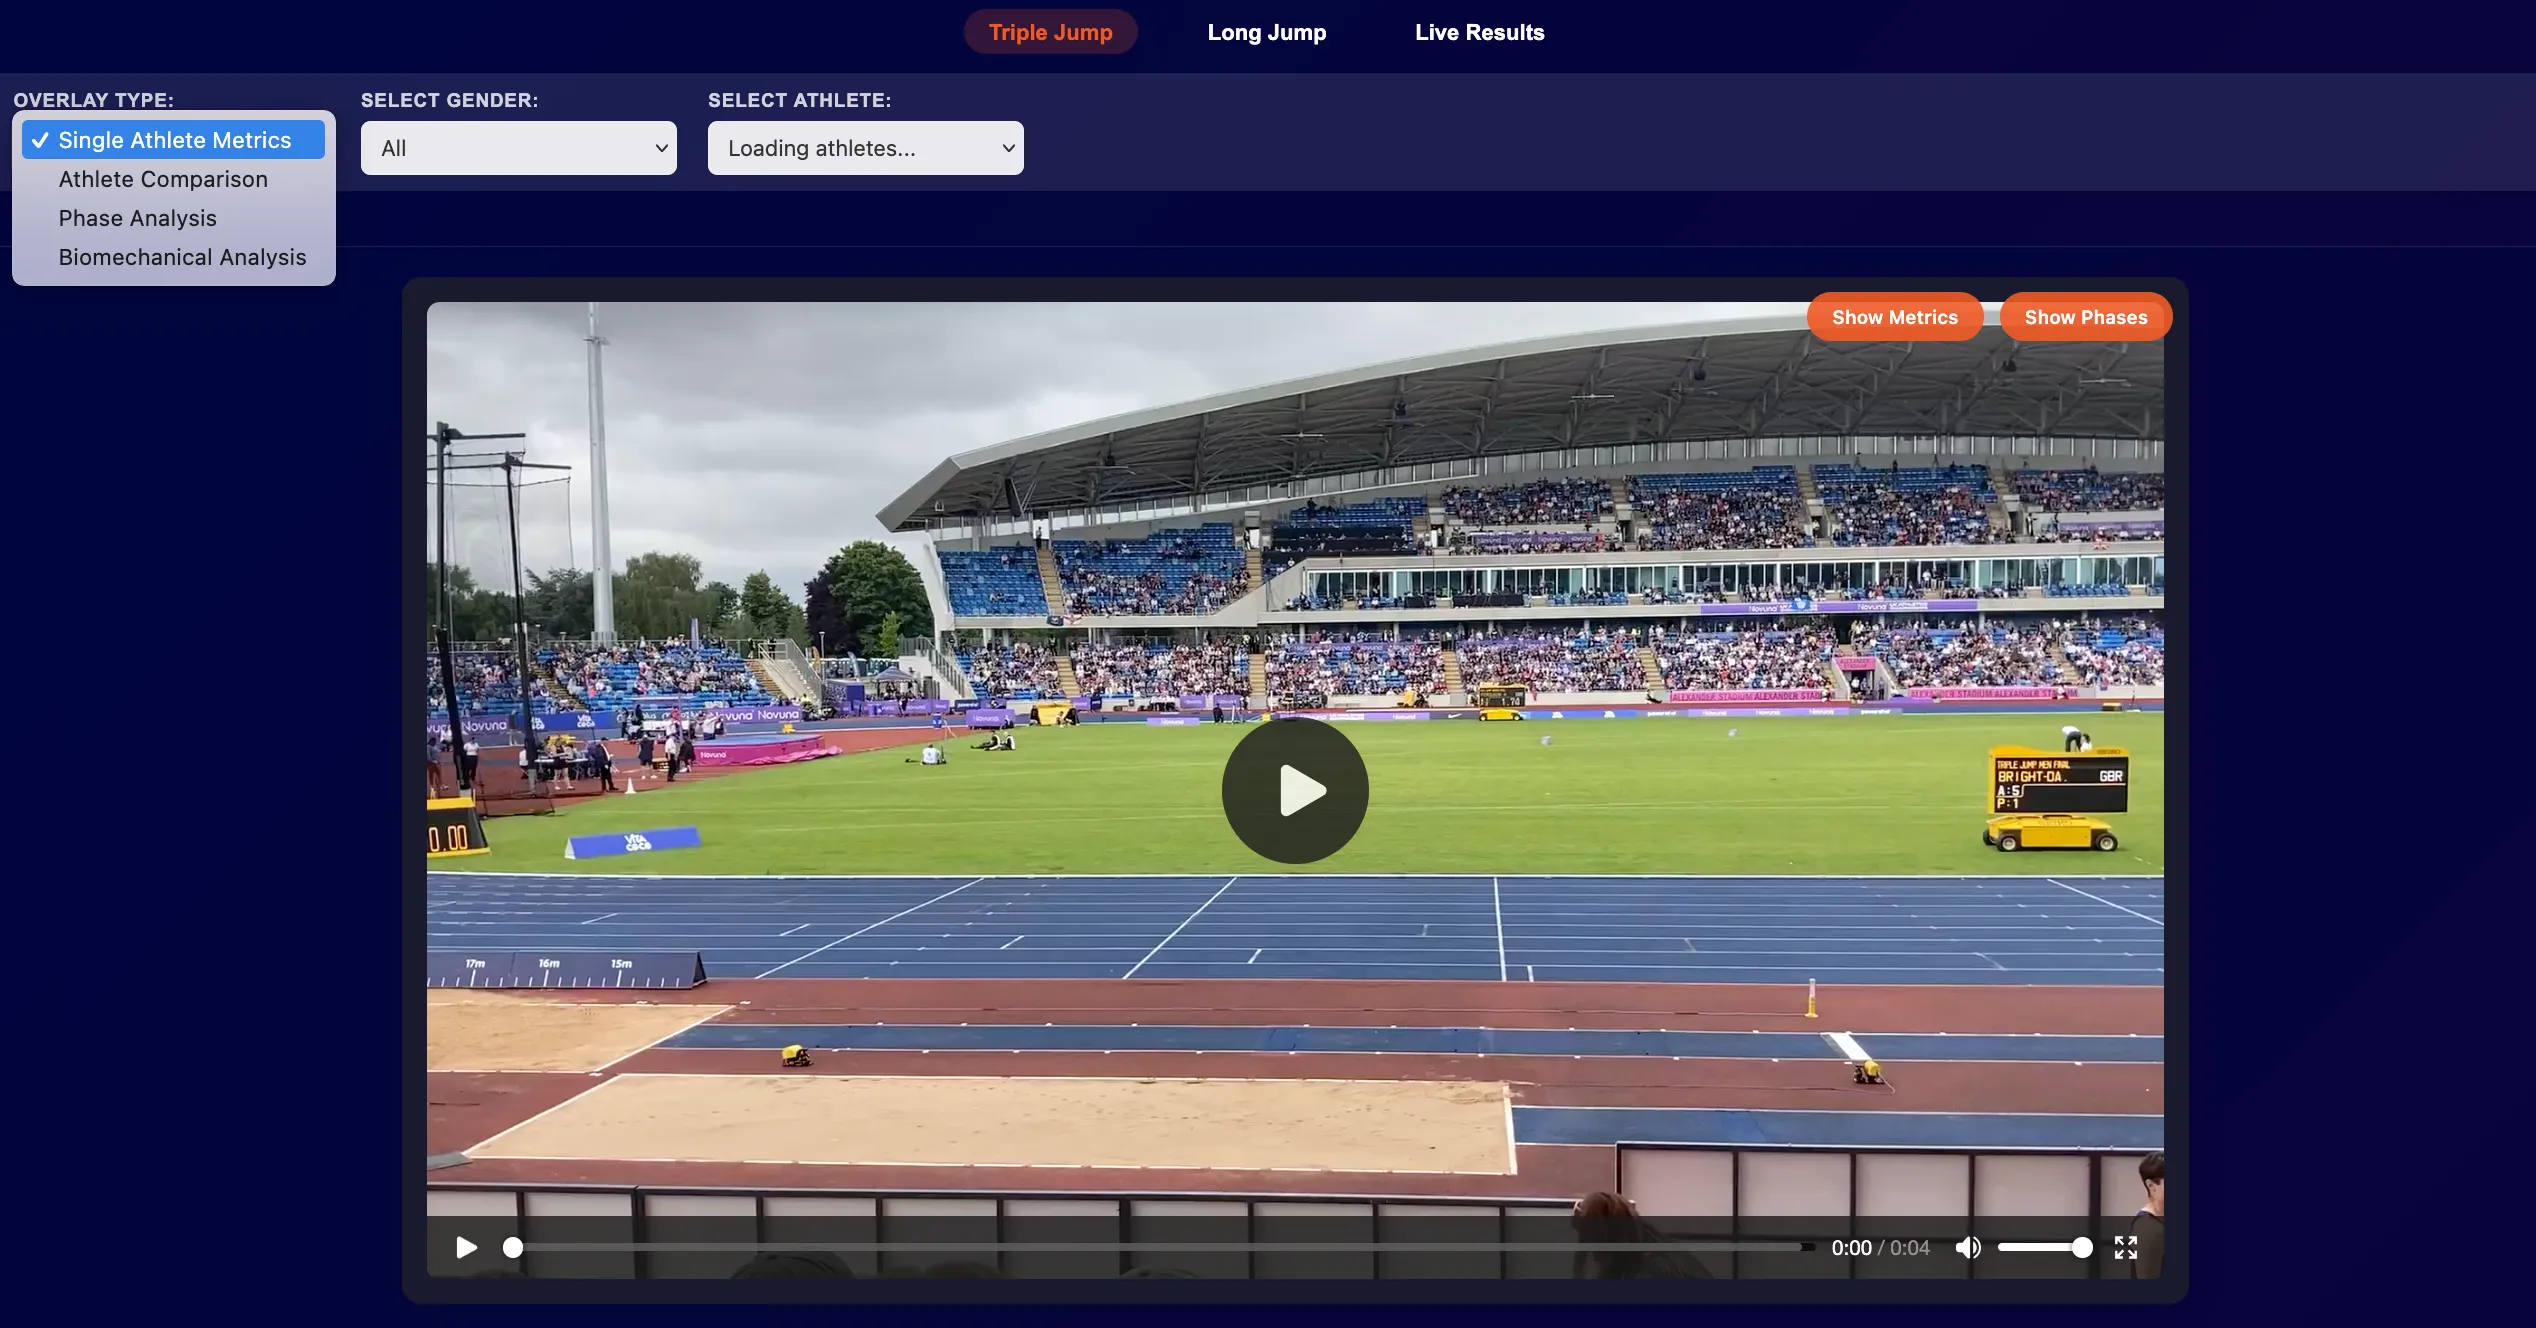 Fig. 7: Overlay filters available.
Two buttons, Show Metrics and Show Phases, are included in the video interface to display phase distribution and relevant metrics.
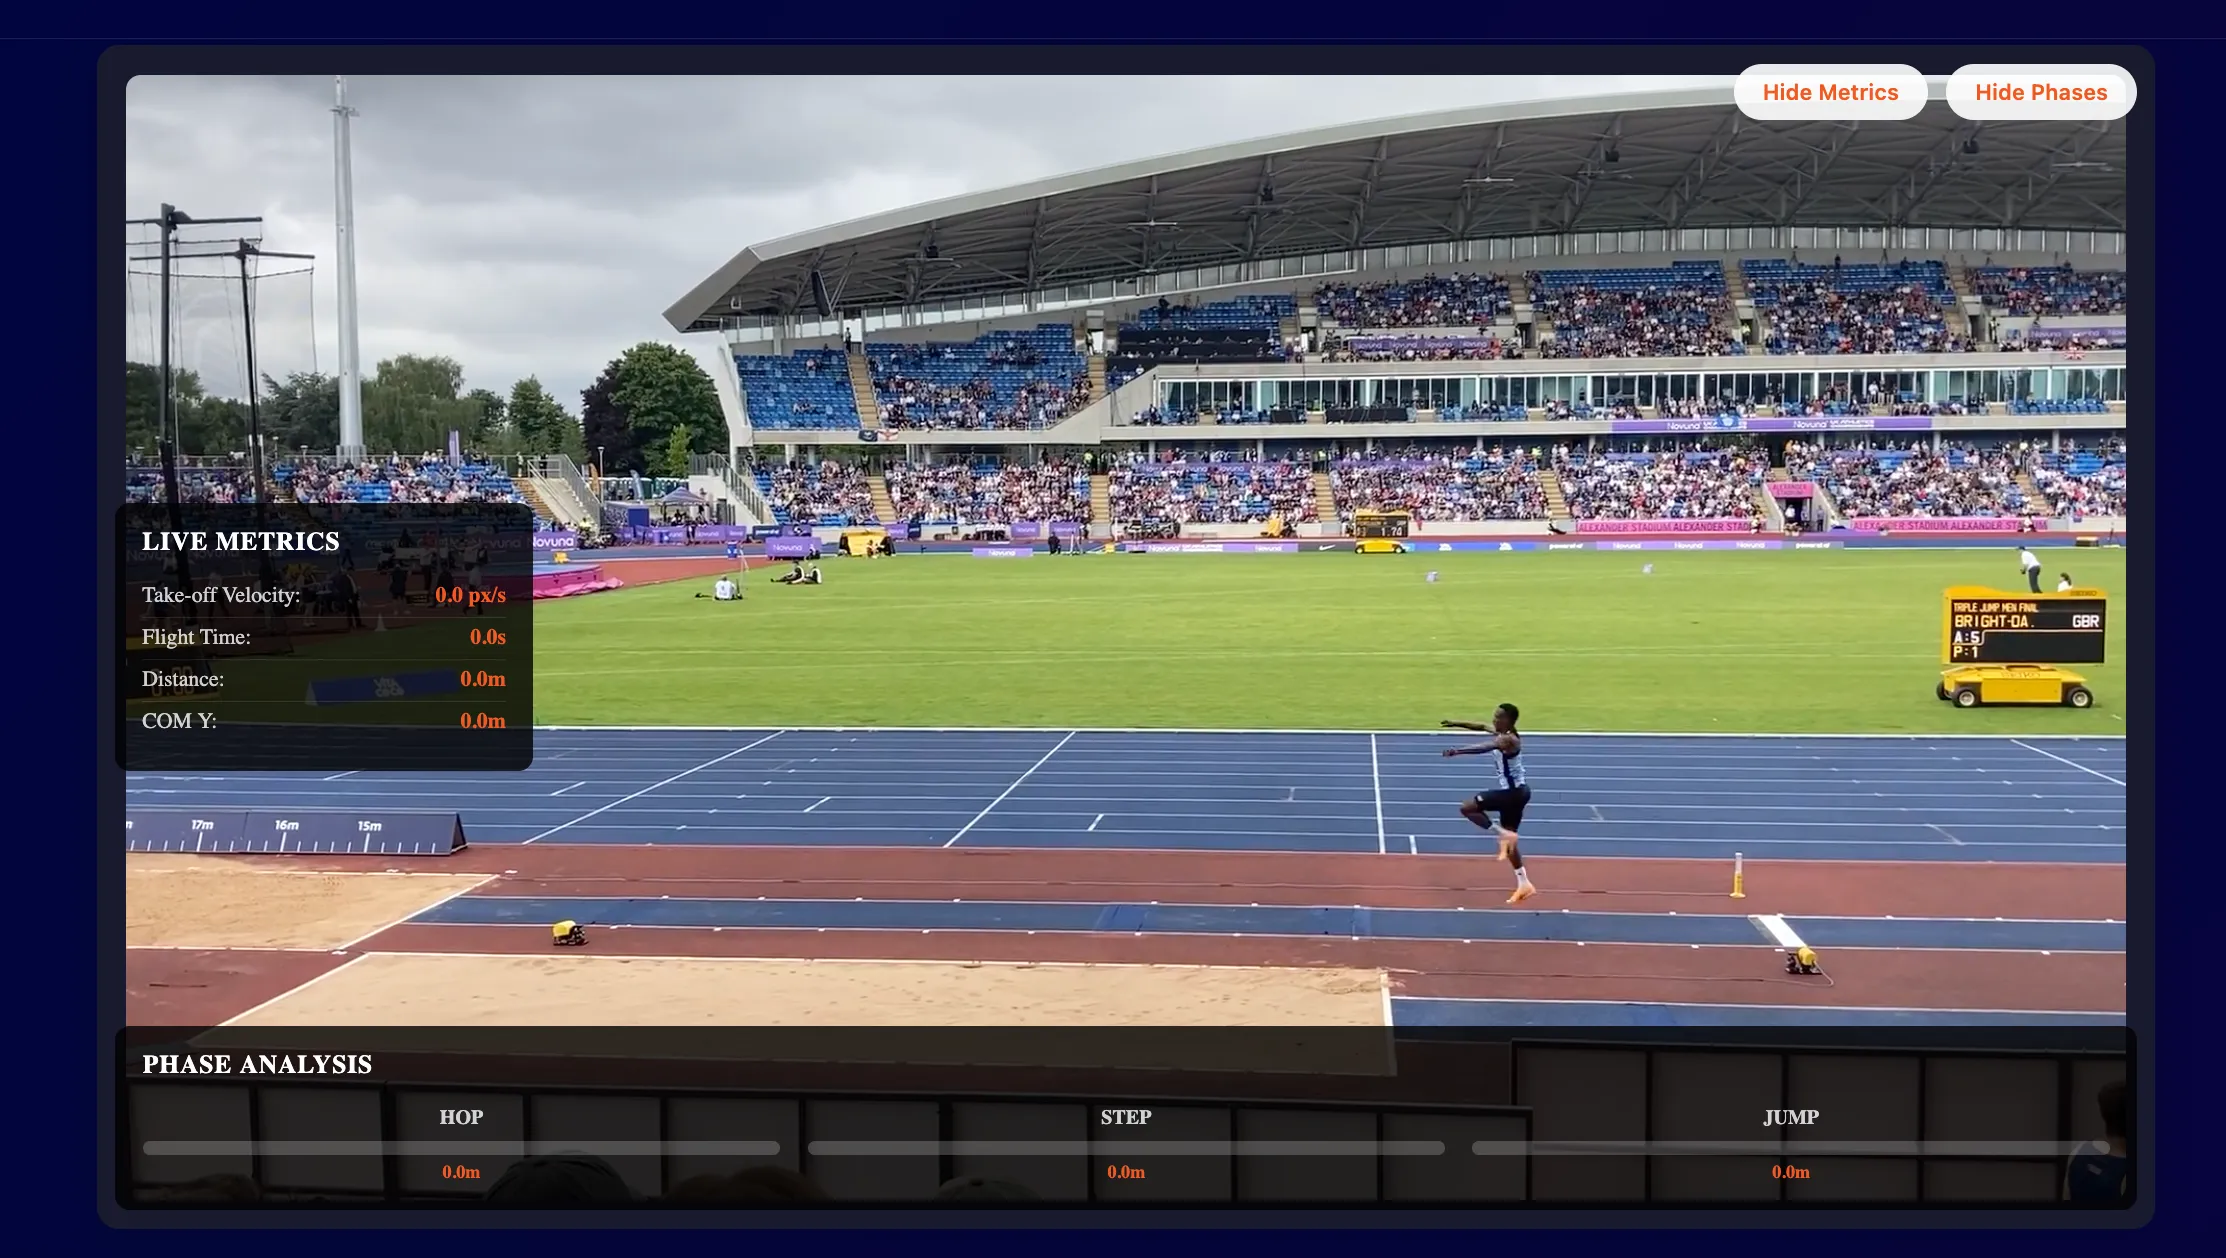 Fig. 8: Example of video overlays.
The same design is implemented for Long Jump.
The live results section provides users with the option to select an event they wish to view live results for.
In the following example we view the triple jump finals at the European Championships in Rome 2024. As the live results are updated a graph is also dynamically generated displaying how the attempts progress.
A live performance graph is plotted whilst the board is updating. The final graphs demonstrate progression through attempts.
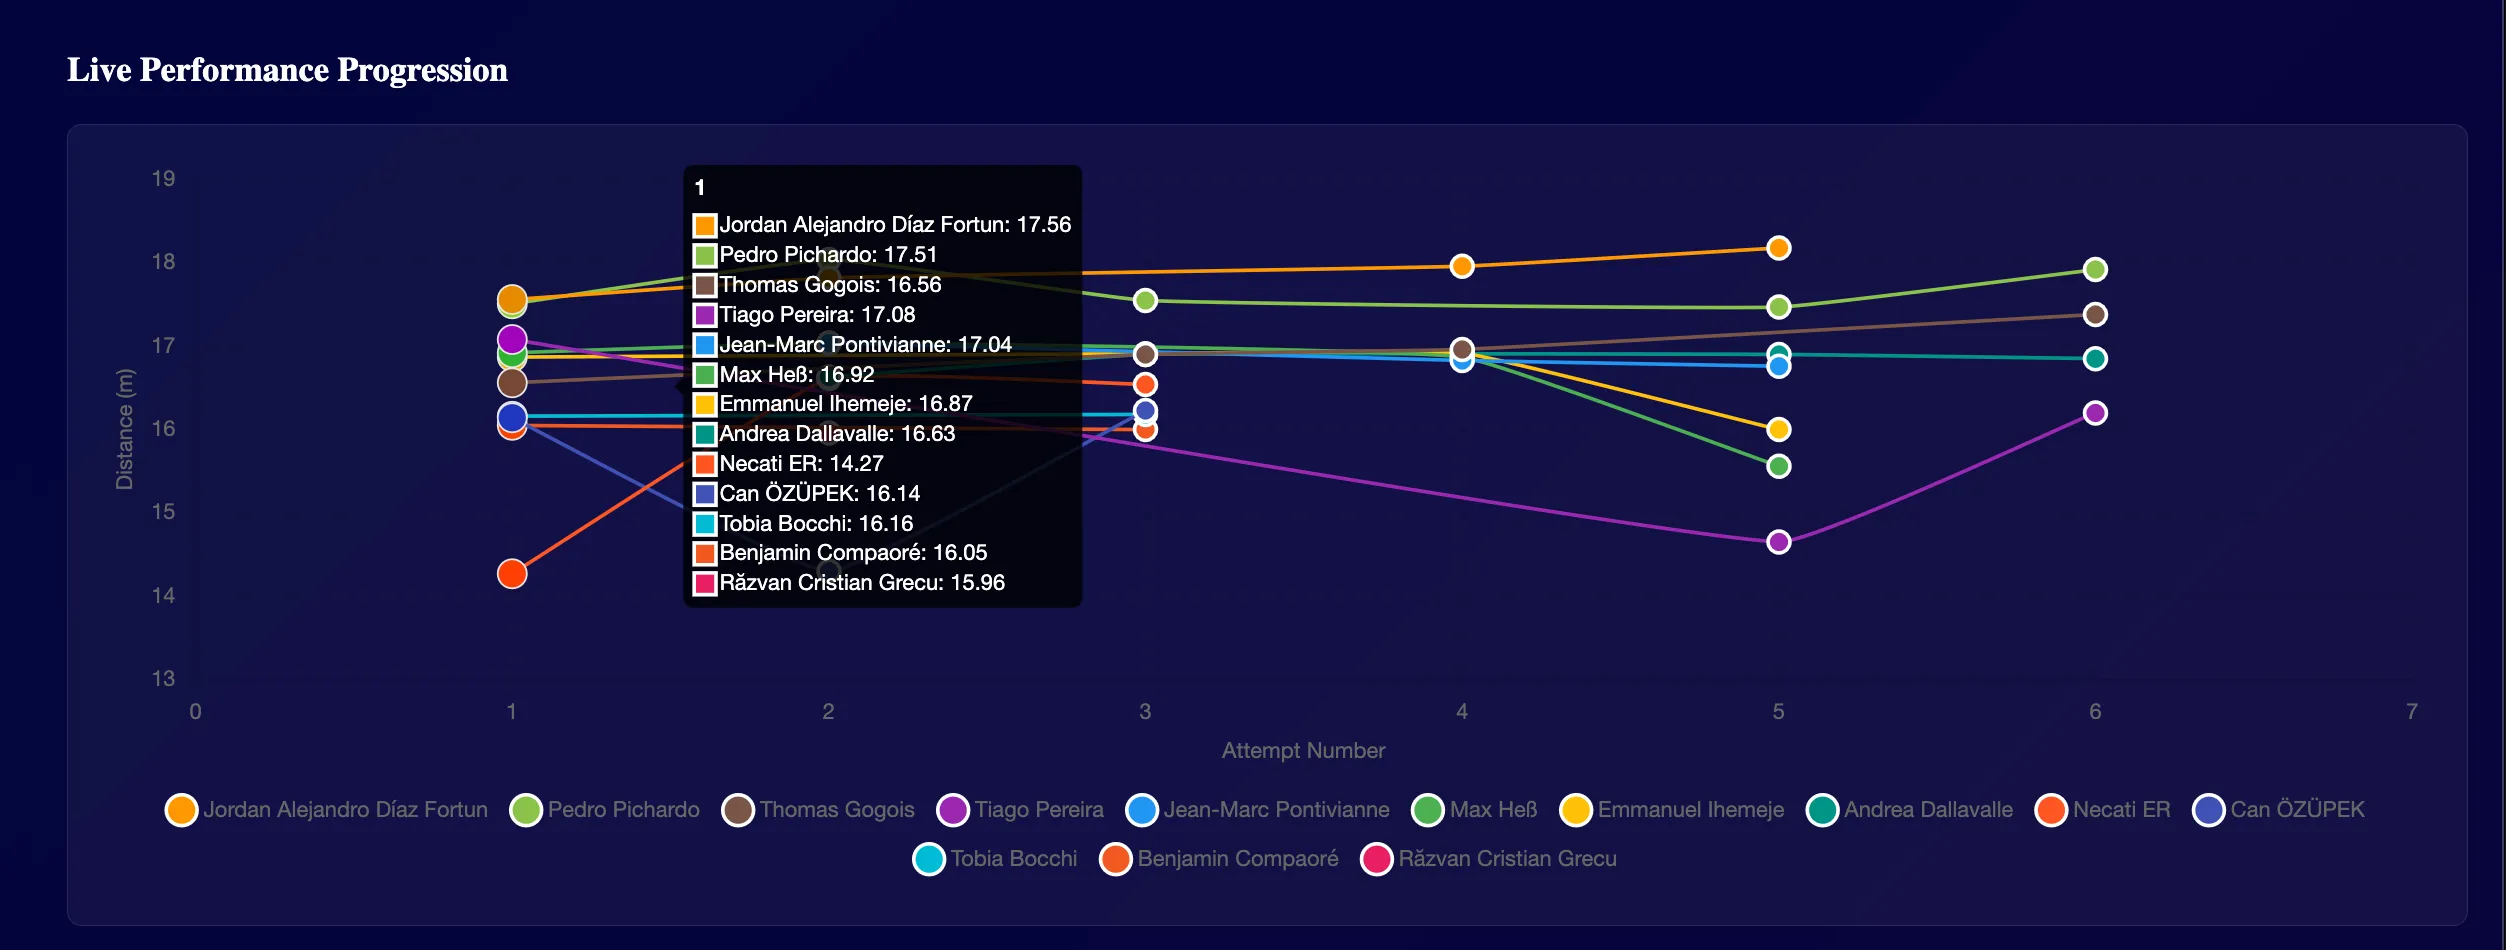 Fig. 9: Simulation of live performance progression leaderboard.
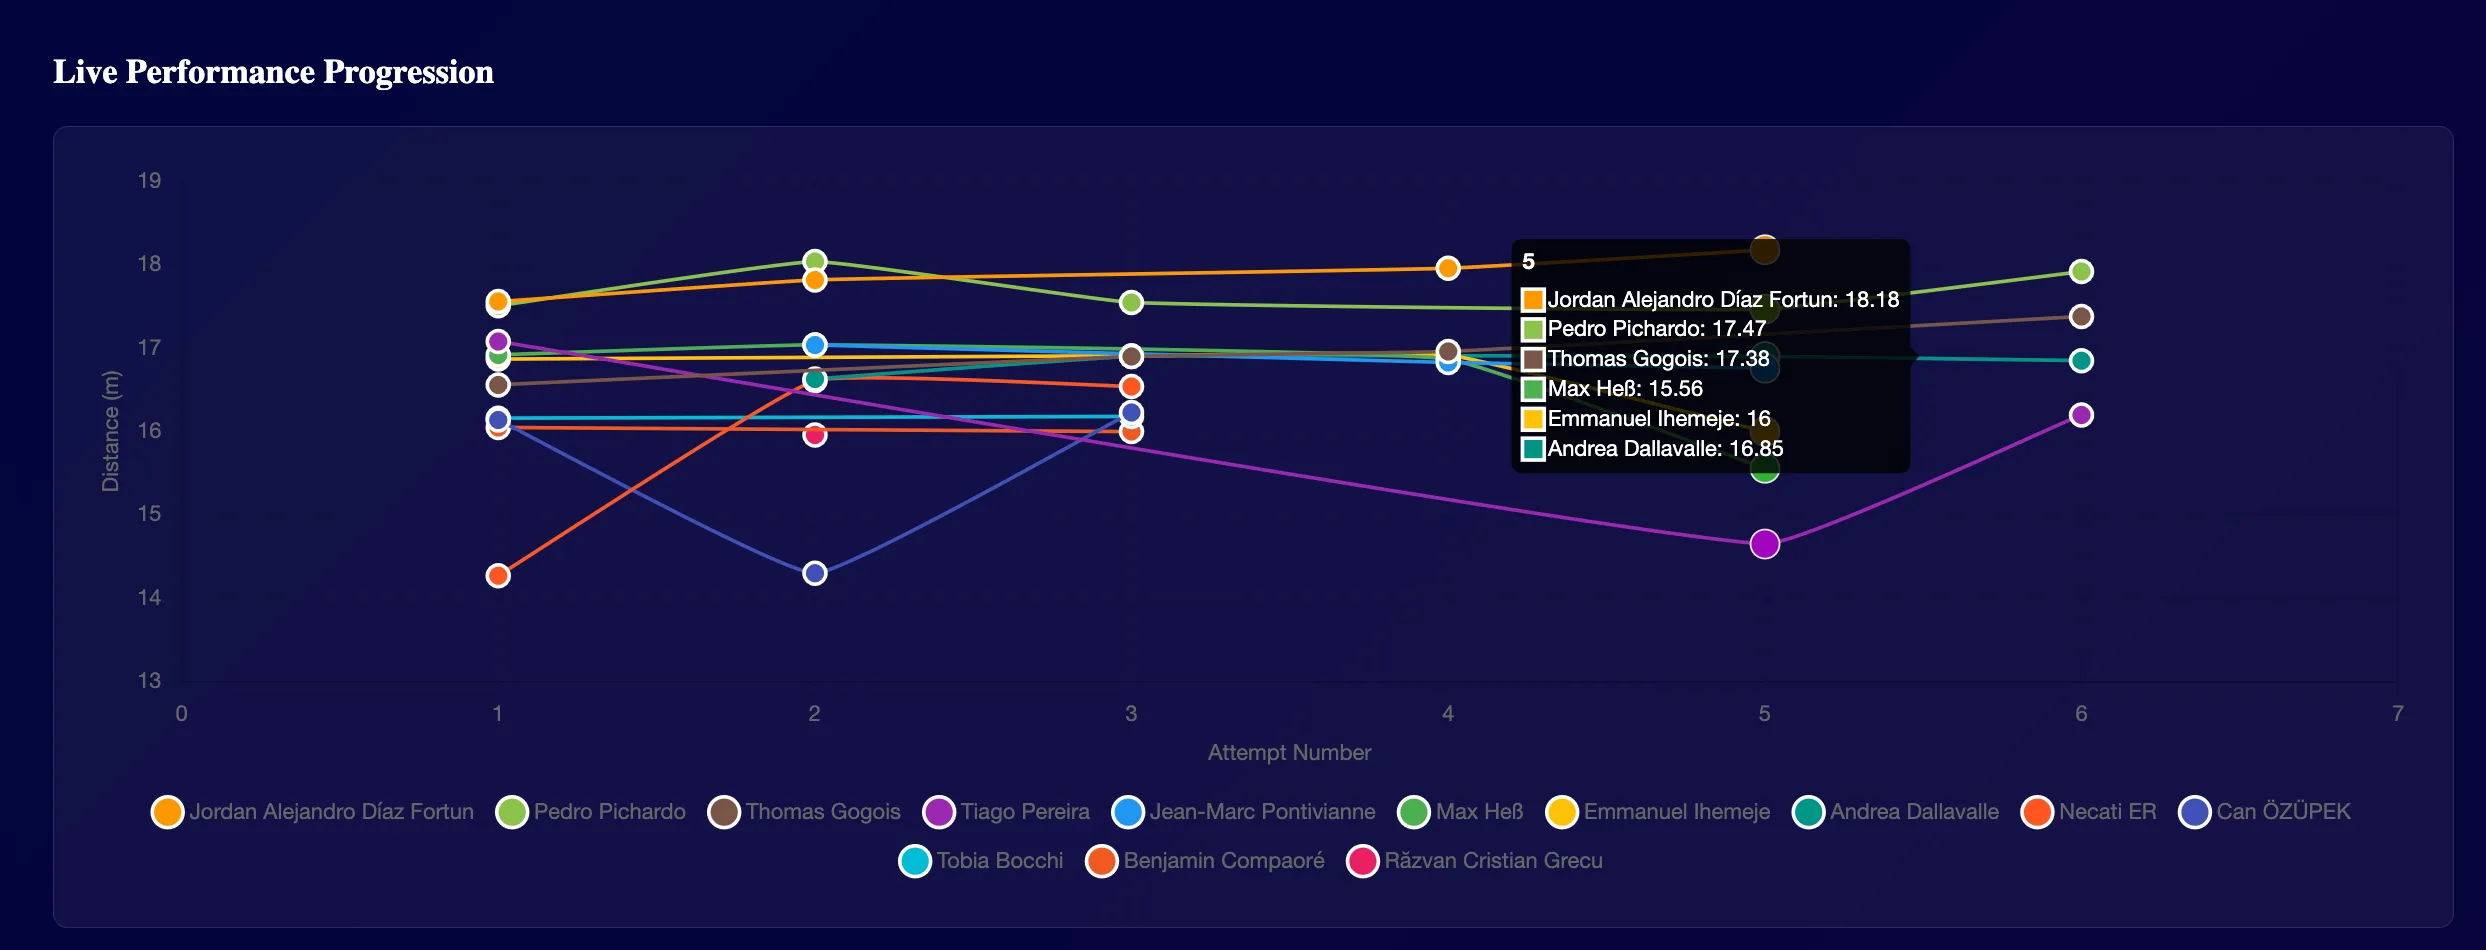 Fig. 10: Simulation of live performance progression dynamic graph.
ATHLETES & DATA
Athletes can be searched via the Athelte Profiles subsection.
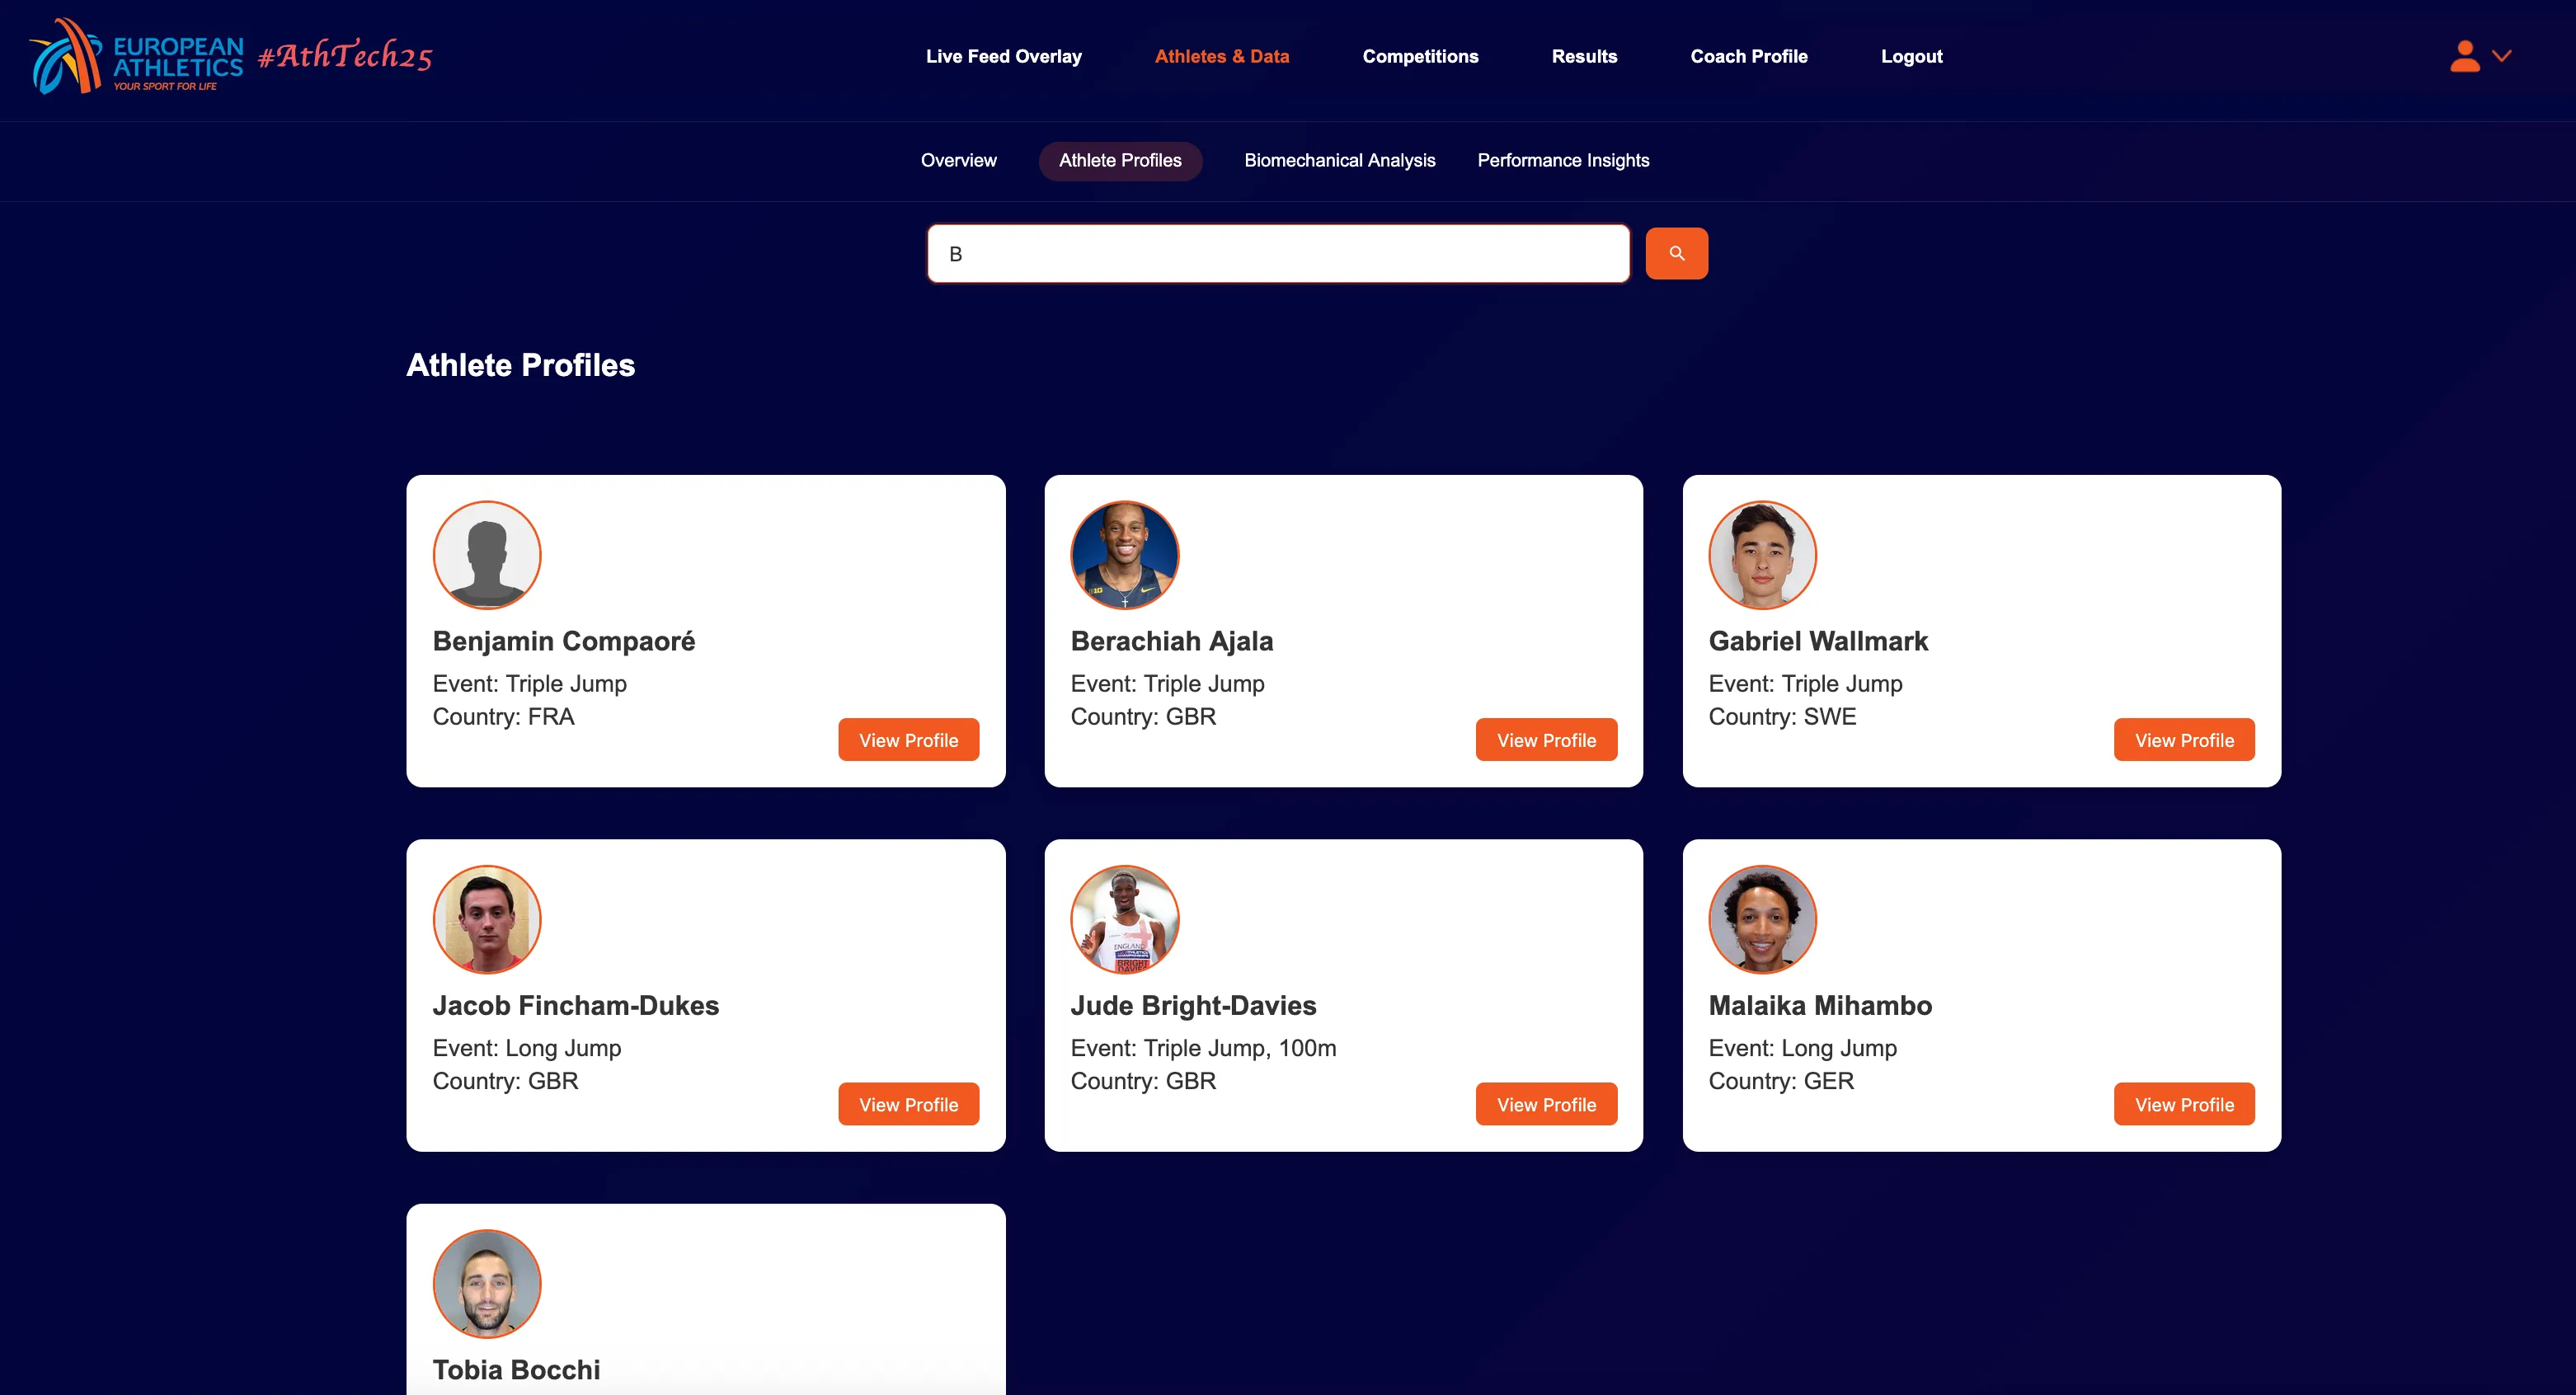 Fig. 11: Athlete search filter.
When an athlete is selected their profile is loaded on the page.
COMPETITIONS & RESULTS
4.2 Hardware
The hardware for grassroots level competitions has two independent components, a competition-grade equipment that closely follows the design of [1], and a standalone smart belt system for training purposes. The smart belt specifications are not included in this submission as they are part of ongoing work which I hope to commercialise in the future.
Whilst the previous camera system from Panoutsakopoulos, V., & Kollias, I.A. utilises two cameras, JumpLens equipment incorporates an additional camera to cover the run-up.
4.2.1 System Architecture
Three cameras of at least 100 FPS and 1080p resolution should be placed between 7-15m from the runway at a height of 1.15m and perpendicular to the plane of motion [1],[2]. The three cameras capture the last 11m of the run-up phase, followed by the hop, step, and jump phases respectively.
Note, however, that to obtain the complete speed profile for the run-up speed curve, an additional camera should be incorporated.
LEDs should be placed as per Figure 12 to synchronise the three cameras as suggested in [1]. A calibration frame must be recorded before commencing the recording to map 2D frames into 3D coordinates.
 Fig. 12: A modified design of the biomechanical research project by Brüggemann, G.P. & Arampatzis, 1997 [2]
Subsequently, the Direct Linear Transformation algorithm is then employed to calibrate and reconstruct the spatial coordinates from the data. The objective is to provide coaches with their athletes’ horizontal velocity and assess the velocity loss that occurs through each phase. A similar method can be applied to long jump analysis.
4.2.2 Processing Unit & Installation
Computational power is paramount for the system to function correctly and provide real-time analysis. Therefore, multiple GPUs and quick data access are beneficial. Using high performance computing (HPC) resources would allow optimisation of computer vision and ML algorithms, therefore ensuring data is provided in real-time.
Each track is designed slightly differently, and because of the installation requirements from Figure 12, more work is needed to understand how the system can be standardised across different venues.
There are still significant challenges that need to be considered aside from the one mentioned above, such us how to ensure raliable internet connection and reliable infrastructure and monitoring.
5. Innovation & Impact
View Content
JumpLens not only provides a new method to visualise data and provide visual cues, it also introduces a platform for decentralised data to be displayed for coaches to support their training and performance analysis.
It introduces a way to access metrics that can aid storytelling, allowing spectators to better understand highly technical events, such as triple jump.
This approach can be expanded to other field events and support coaches and athletes regardless of where they train in the world, especially during the athletes’ younger years of development where strong foundations must be established.
To conclude, it will not only benefit individuals that practice or teach athletics, it will inherently change the way field events are experienced.
6. Feasibility
View Content
This project is dependent on the availability of accessing decentralised data from SEIKO and OMEGA, including historical data. There is a wealth of data available, and the current state-of-the-art equipment is extremely sophisticated, which means building JumpLens for elite-level competitions is feasible in the near future.
Incorporating the platform at the grassroots level presents greater challenges due to its dependence on the development of the hardware described in section 4.2. Nevertheless, given the wealth of research conducted since the 1990s, including previous hardware systems built for this purpose, it is feasible to achieve such a system.
Key challenges include designing the system to be independent of venue-specific installation requirements, whilst ensuring robust cloud infrastructure to facilitate efficient real-time data flow. The feasibility of this project ultimately depends on establishing partnerships with equipment manufacturers and developing scalable hardware solutions for grassroots implementation.
References
[1] Panoutsakopoulos, V., & Kollias, I.A. (2008). Essential parameters in female triple jump technique. New Studies in Athletics, no. 4/2008, pp.58. Accessed 26th June 2025, https://api.semanticscholar.org/CorpusID:59568698
[2] Brüggemann, G.P. & Arampatzis, A. (1997). Triple jump. In: Müller, H. & Hommel, H. (eds), Biomechanical Research Project at the Vlth World Championships in Athletics, Athens 1997: Preliminary Report. New Studies in Athletics, 12 (4), 59-66.
Appendix A: Data Flow
DATABASE SCHEMA
Athlete Data
JUMPLENS_ATHLETES: Basic athlete information (name, country, PB, etc.)
Performance Data
-
JUMPLENS_ATHLETES_PERFORMANCE: Athlete performances. -
JUMPLENS_PHASE_DISTANCES: official and effective phase distances. -
JUMPLENS_TAKEOFF_VELOCITIES: take-off velocities and corresponding angle of projection. -
JUMPLENS_COM_VELOCITY_CHANGES: Center of mass velocity changes during triple jump phases. -
JUMPLENS_LANDING_DISTANCE_VELOCITIES: Landing distance and ankle velocity at contact. -
JUMPLENS_STRIDES_LENGTH: Stride length data and C.O.M. horizontal and vertical velocities. -
JUMPLENS_AVG_CONTACT_AND_FLIGHT_LENGTH: Contact flight times.
Competition Data
JUMPLENS_COMPETITIONS_DETAILS: Competition information (venue, date, etc.)
Identity Data
-
JUMPLENS_USERS: Coach and user profiles. -
JUMPLENS_USER_SESSIONS: Login sessions
Topics
- Athletics Data Standardization
- Triple Jump Phase Distribution
- Run Up Speed Curve
- Direct Linear Transformation
Tech Stack
- OpenCV
- Pose Estimation
- Python
- HPC - High Performance Computing
- Docker
- Three Camera System
- Supabase